01 March, 2021
Sue Trinh, Senior Macro Strategist

Global stock markets corrected this week (as of 26 February) as the 10-year US Treasury yield climbed to its highest level since February 20201. The rise unnerved investors who fear that higher inflation will spur an-earlier-than-indicated rate hike from the US Federal Reserve (the Fed). In this note, Sue Trinh, Senior Macro Strategist shares her thoughts on rising bond yields, global liquidity, and the implication for equities.
Global stock markets corrected this week (as of 26 February) as the 10-year US Treasury yield climbed to its highest level since February 20201. The rise unnerved investors who fear that higher inflation will spur an-earlier-than-indicated rate hike from the US Federal Reserve (the Fed). In this note, Sue Trinh, Senior Macro Strategist shares her thoughts on rising bond yields, global liquidity, and the implication for equities.
It’s also worth noting that although the Fed has signaled it’s unlikely to add any additional easing aimed at the real economy, the Bank of England, the European Central Bank, and the Bank of Canada have all made it clear that rate cuts remain on the table. While we don’t expect these central banks to cut rates, we believe that relative monetary policy divergences between the Fed and other major central banks are only going to get wider. The one exception here being the People’s Bank of China, which is in tightening mode.
That said, we have been closely watching the slowdown in global liquidity growth. In level terms, global liquidity (proxied by global money supply) has topped out in 2021, flat-lining around US$96 trillion year-to-date 2 . Importantly, the growth in global liquidity has slowed markedly, from 40%+ to 4.8% on a three-month percentage-change basis, with slowing balance-sheet expansion from the Fed and the People’s Bank of China (PBOC), as the major drivers of this dynamic.
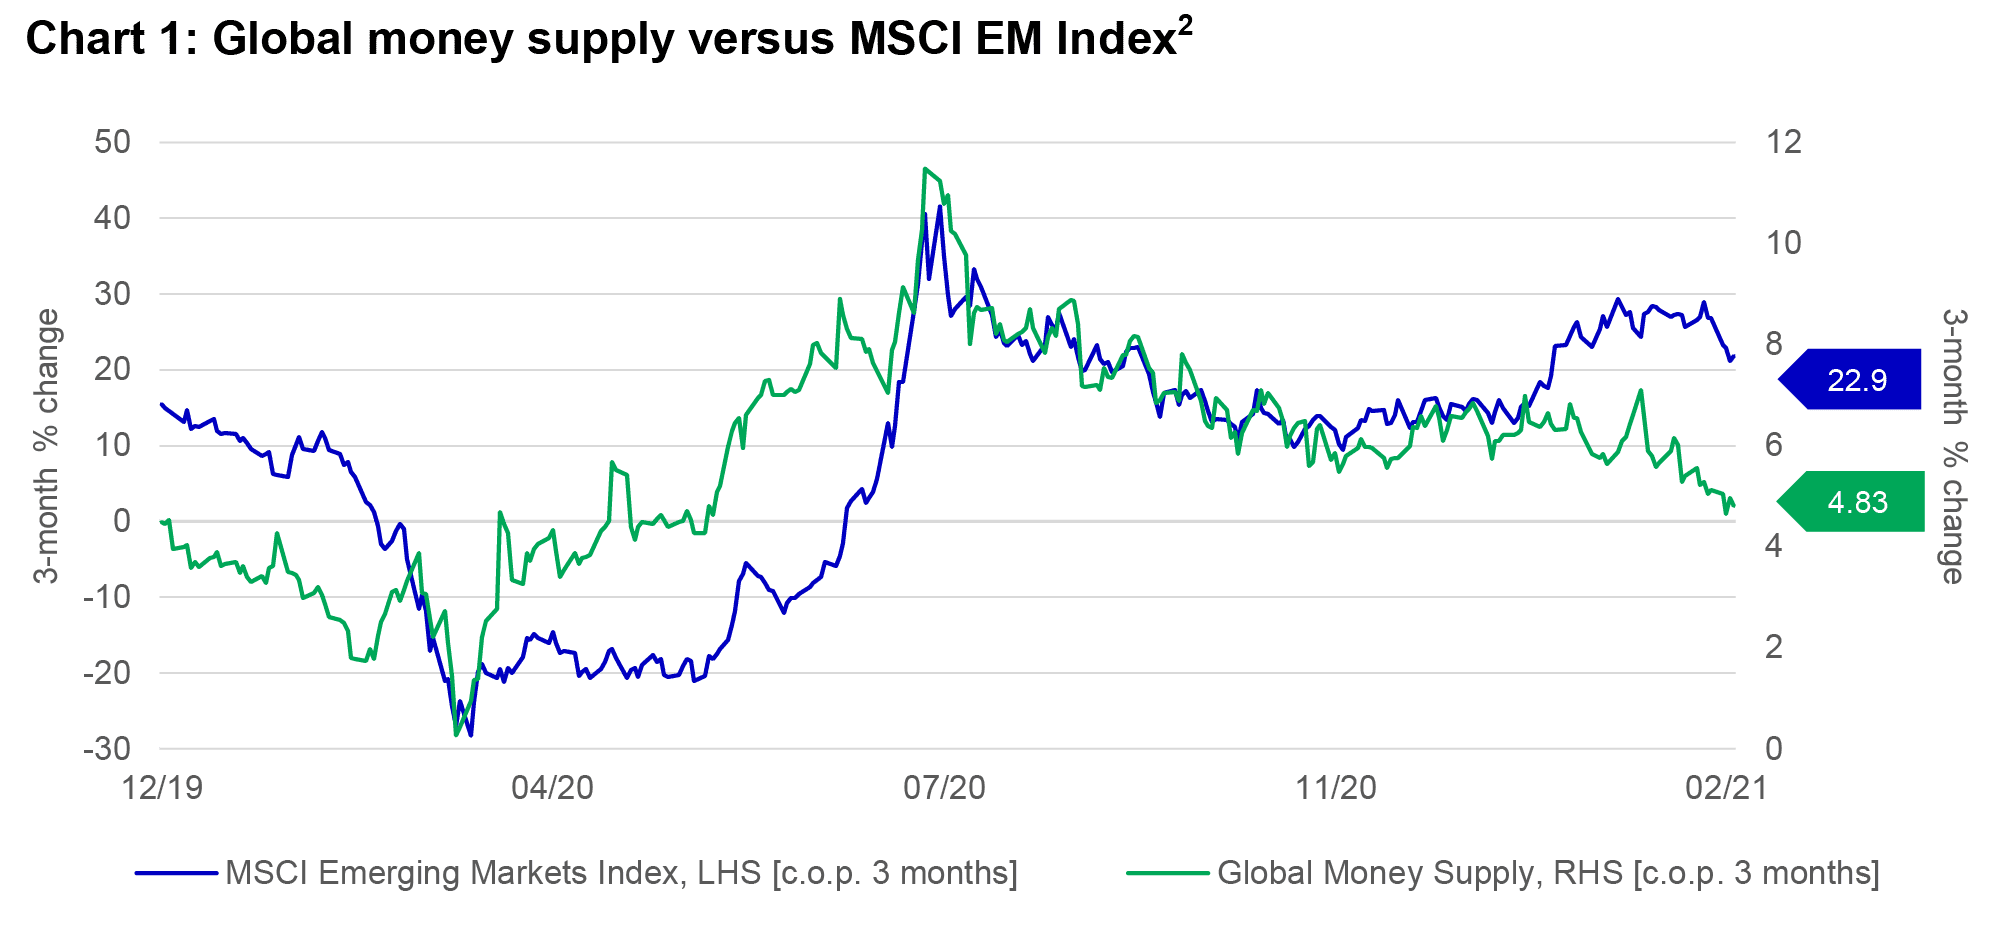
Chart 1 shows the three-month growth in global liquidity (green line) against the three-month change in MSCI EM equities. In our view, the chart has been flashing a warning sign in that EM equities had become overextended relative to global liquidity growth.
This is corroborated by Chart 2, where we adjust and normali se the market capitali sation of developed markets (DM ) and EM equities for global liquidity. By this metric, the market cap of EM is running over 1 standard deviation above its long -term average. In contrast, the market cap of DM is not stretched.
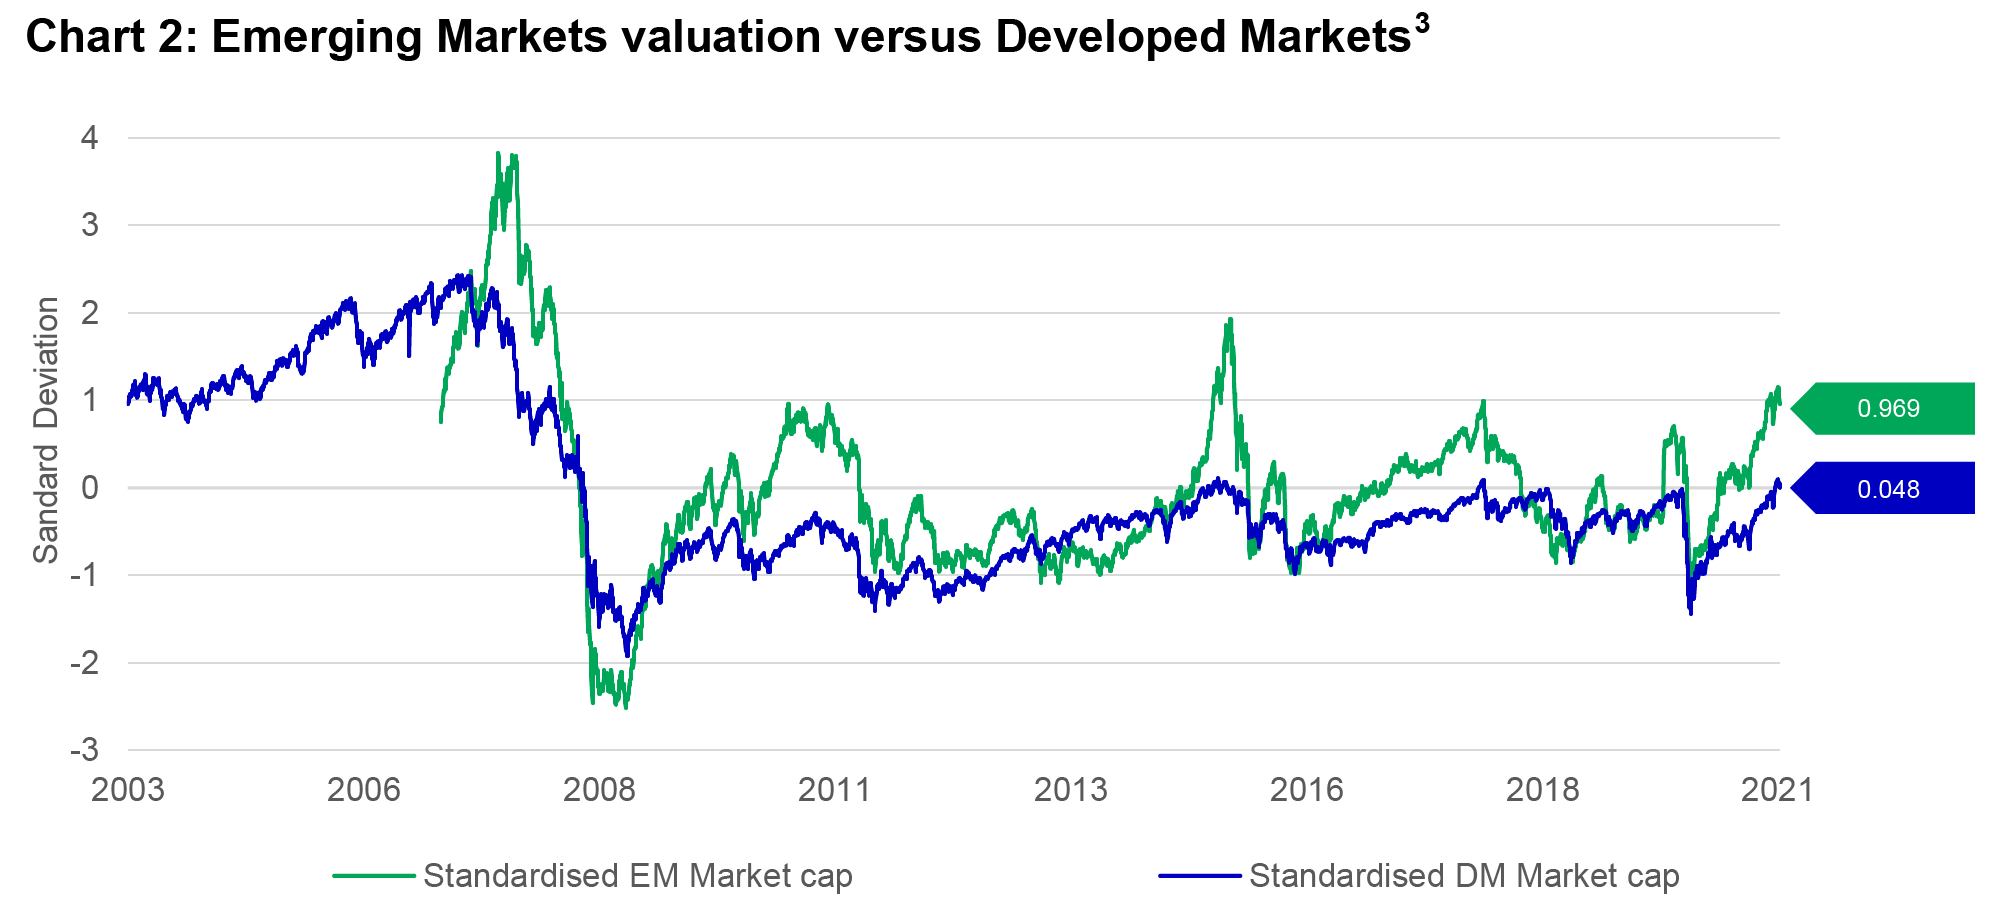
Taken together, this suggests that after the recent strong price recovery, EM may be stretched vis - à -vis DM. At the very least, it implies near -term consolidation. Longer -term, we remain bullish on EM equities, particularly in Asia, and would view any correction as an opportunity. Meanwhile, on a global basis , the largest central banks have likely hit peak liquidity. In our view, the respective biases of the various major central banks strengthen our belief that the US dollar could experience some countertrend rallies in the short term, which tend to be supportive of US equities.
1 Bloomberg, as of 26 February 2021.
2 Bloomberg, Macrobond, Manulife Investment Management, as of 25 February 2021.
3 Bloomberg, Macrobond, Manulife Investment Management, as of 26 February 2021.
Key takeaways from Chinese mainland NPC meeting
The annual meeting of Chinese mainland’s National People’s Congress (NPC) is concluding this week. The China equity team shares its latest views on key policy developments and analyses the main growth engines supporting high quality growth.
Latest asset allocation views amid latest Middle East developments
Against a backdrop of elevated uncertainty, the Multi Asset Strategy Team (MAST) summarizes key market moves, and the potential cross-asset implications.
Latest asset allocation views for Asia Q1 2026
Three key global themes for the first quarter: Liquidity and stimulus set the stage for 2026; AI remains a structural growth driver; Accelerating growth may favour diversification

© 2026 Manulife Investment Management. All rights reserved.